
Grafana Dashboards for SCCM (Part 1)

Dashboards preview, prerequisites and installation.
Links
SCCM Dashboards with Grafana (Part 1 — Preview, pre-requisites, installation)
SCCM Dashboards with Grafana (Part 2 — Client, distribution and OS info…)
SCCM Dashboards with Grafana (Part 3 — Updates and SCEP Definitions)
…
This will be a multi part series in which I will cover the installation and configuration of Grafana dashboards for SCCM. They are superior to the built-in reports in every way can can provide a solid monitoring and troubleshooting solution. You also can correlate data very easy and spot problems before things go boom.
Preview
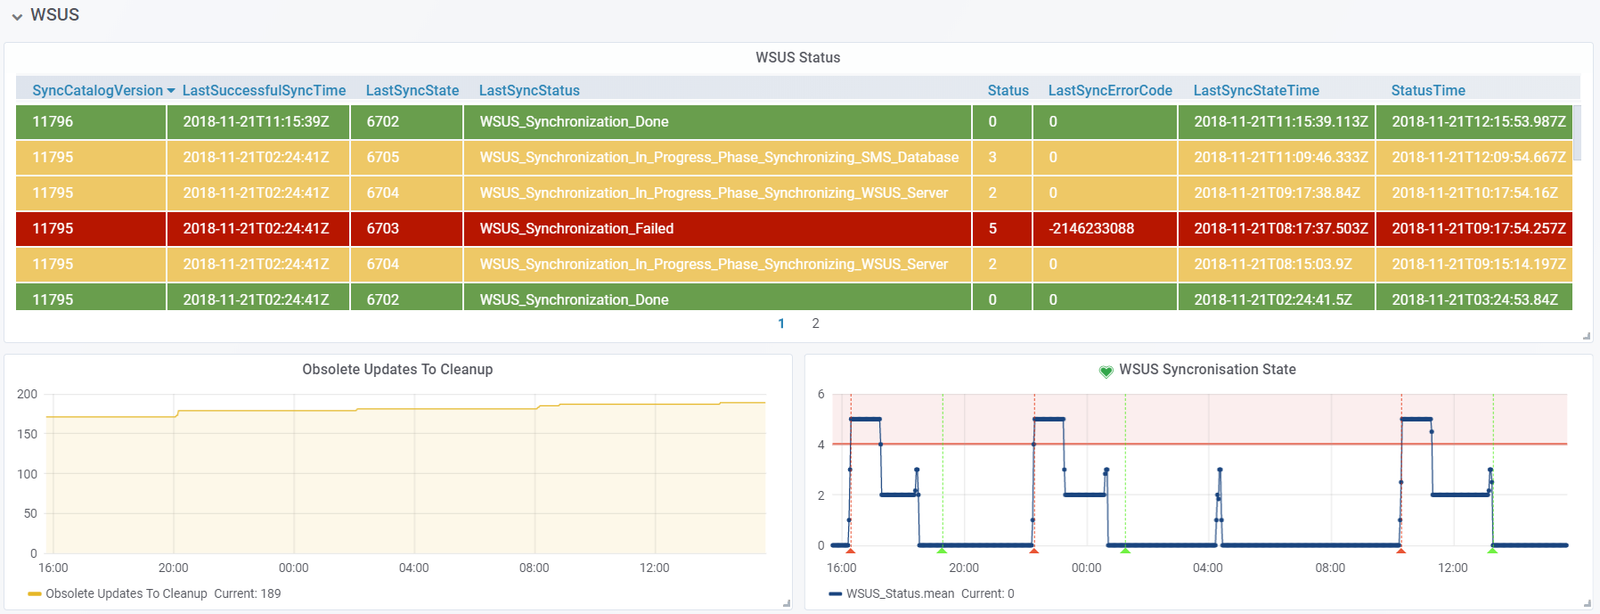
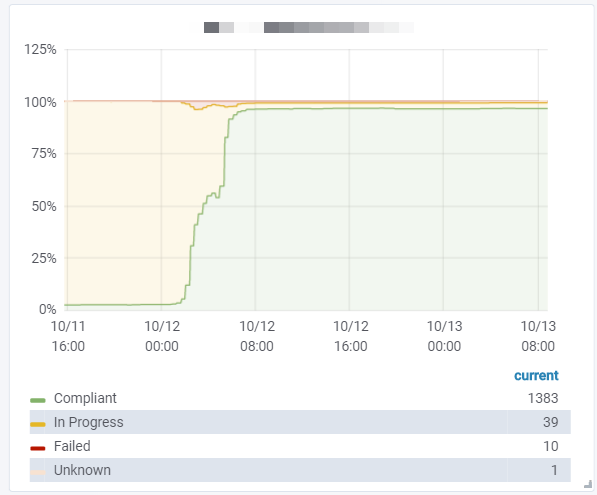
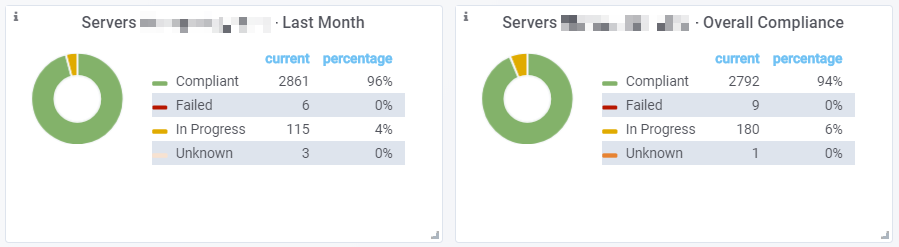
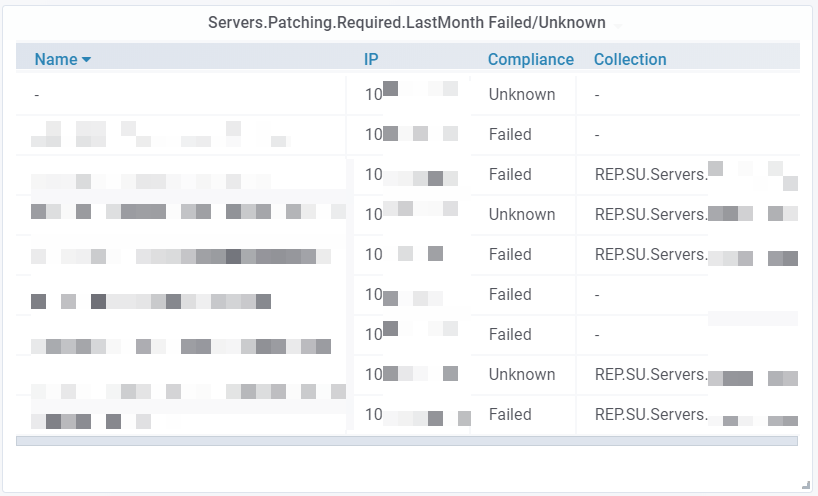
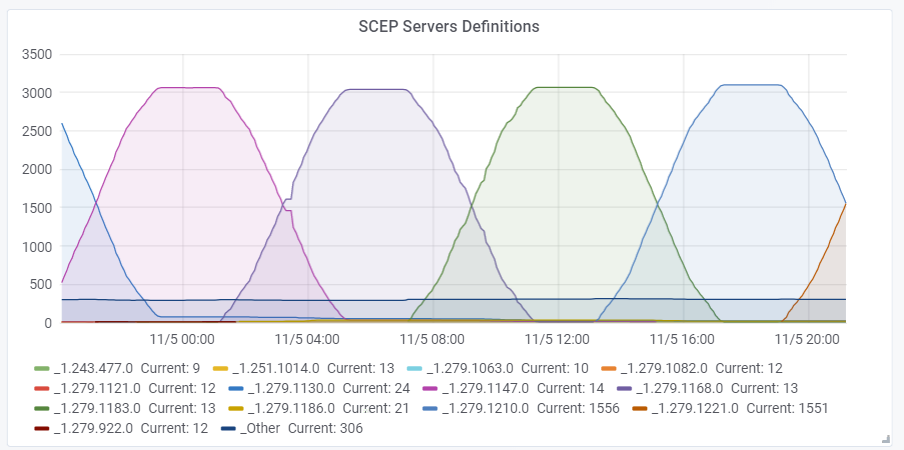
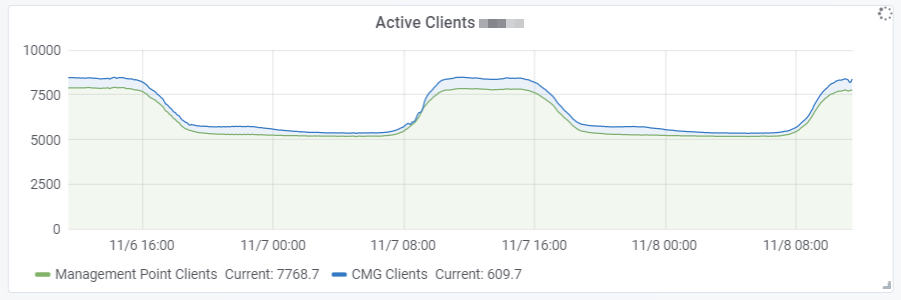

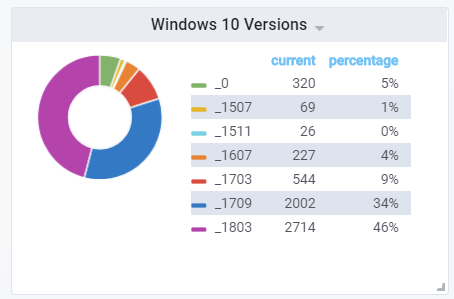
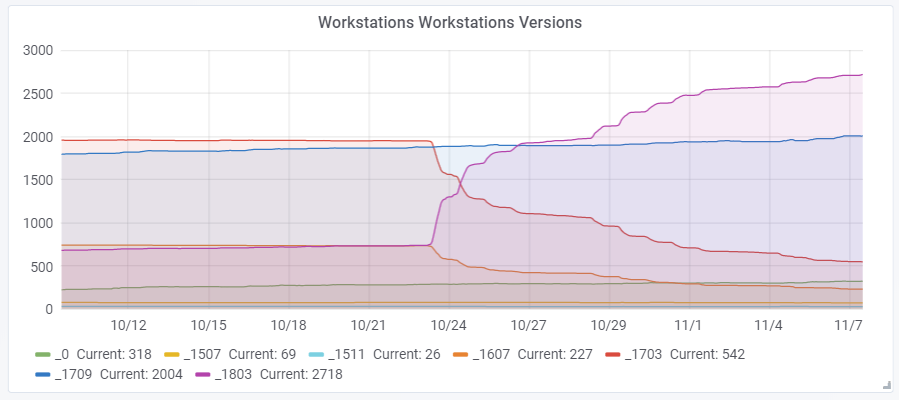
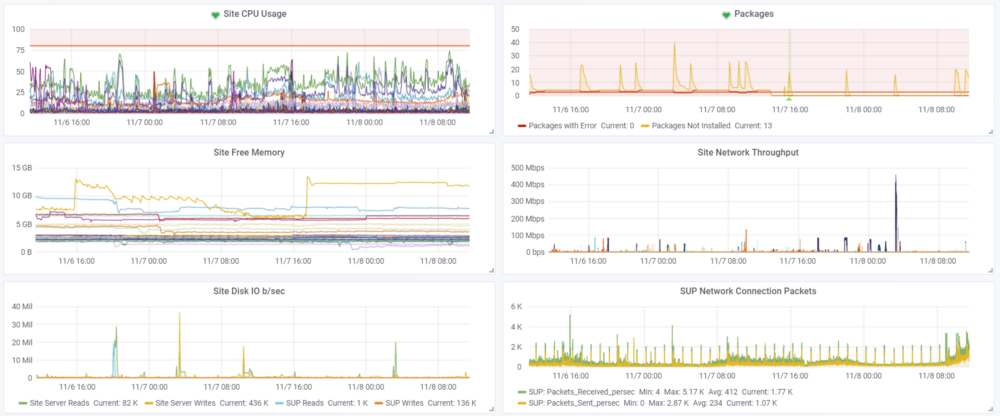
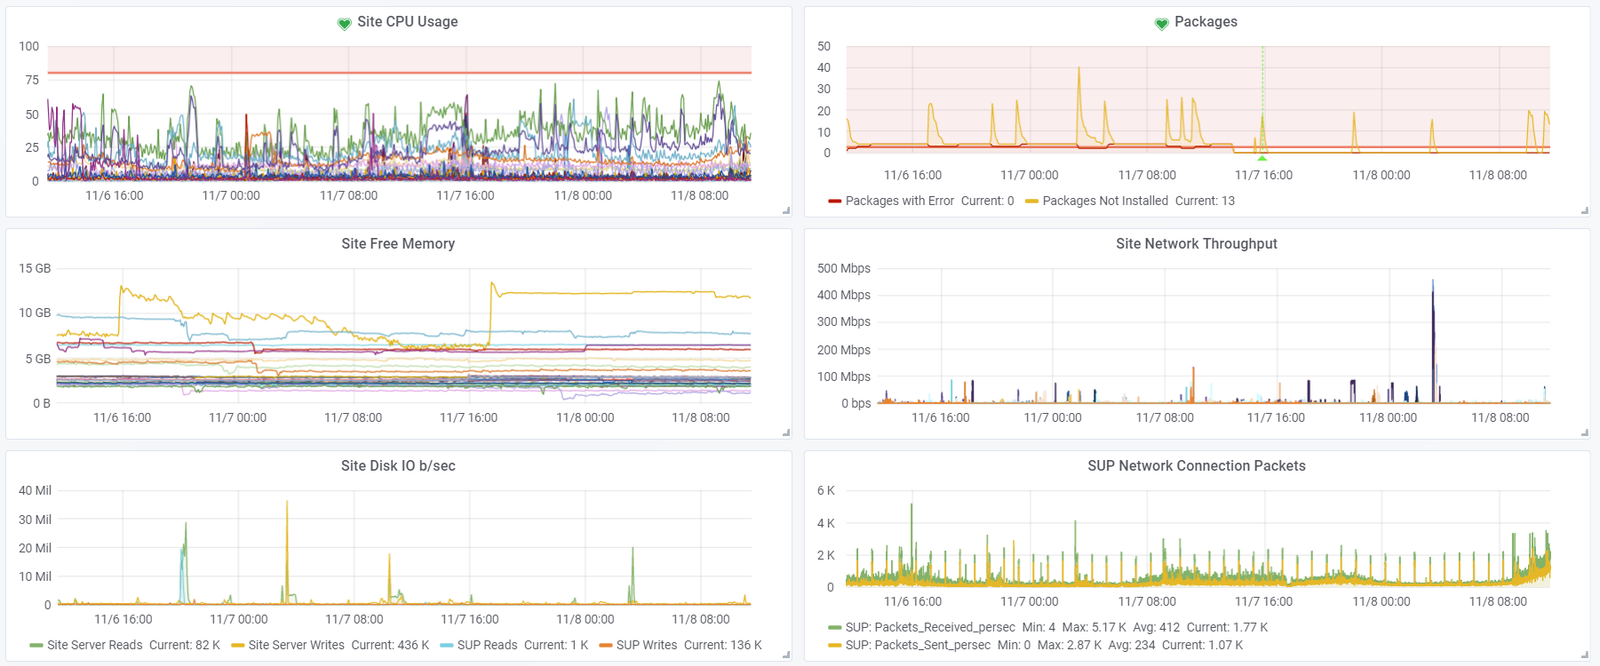
Prerequisites
There are a few things that you will need.
- Grafana (Data visualization & Monitoring for InfluxDB, Graphite, etc)
- InfluxDB (Database to store the data)
- Telegraf (Agent with scripting platform and built-in metrics for InfluxDB)
Installation (Adapted from here)
- Unzip InfluxDB and set up service for InfluxDB with NSSM
- Create database and users
- Go to install location and start influx.exe from the shell
- Create service account for the DB
create database [Your_Database_Name]
create user [Your_Service_Account_Name] with Password [Your_Service Account_Password]
grant all on [Your_Database_Name] to [Your_Service_Account_Name]- Unzip and install Telegraf
- Edit “telegraf.conf” to point to correct server and database
- Unzip and install Grafana to location of your choosing
- Create a data source and configure it for your InfluxDB instance
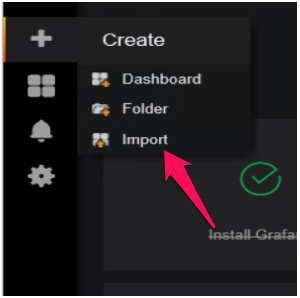
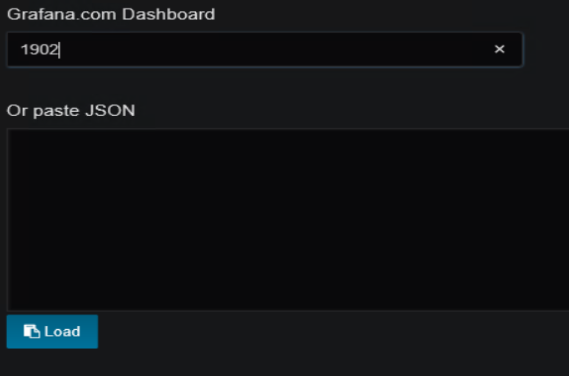
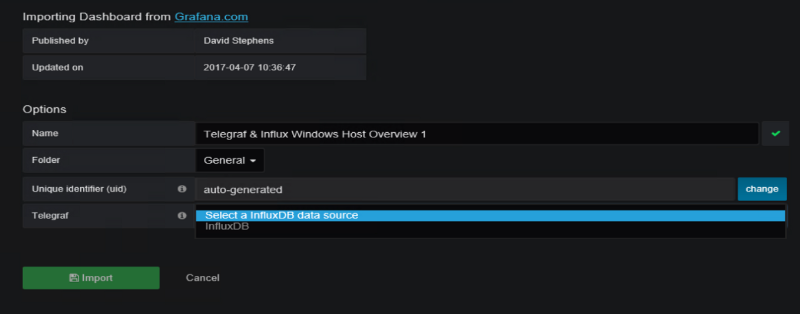
- Create or import one of the available Dashboards
Import Dashboards
Examples
- Performance counters dashboard
- MSSQL monitoring dashboard — Installation instructions here
## !! IMPORTANT !!
## SQL Server Input Plugin (telegraf.conf)
query_version = 1
The next post we will cover client data visualization.

Please, Subscribe and Clap for this article! It makes a difference. Thanks!

Use Github for 🐛 reporting, or 🌈 and🦄 requests